Huygens probe and Reynolds self-similarity

25th January 2018
First week was dedicated to the analysis of the probe data to make analogies between Titan's atmosphere and the wind tunnel. Moreover it is important to work on special features of the Huygens probe such as appendages to verify their influence on the probe moment.
*
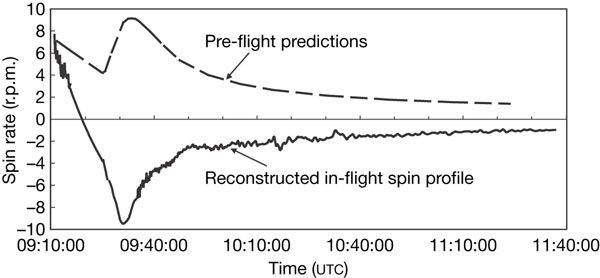
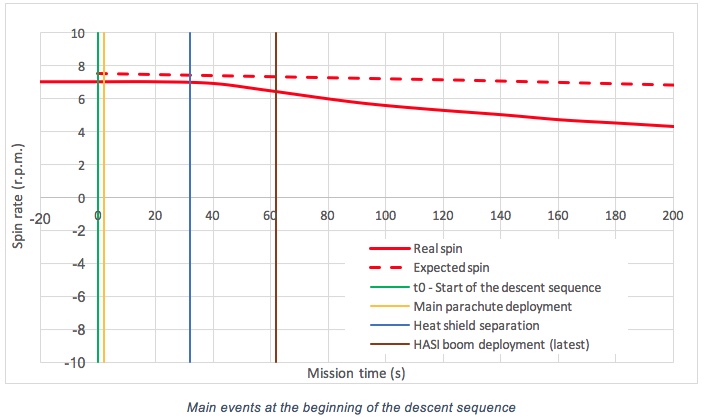
This project is based on previous ESA studies. The difference between the theoretical spin rate of the probe and the actual measures during the descent appears at the very beginning of the main parachute deployment. Indeed, the slope of the experimental yield is more important than the theoretical one.


According to this graph, the real spin departs from the expected rotation when the heat shield is separated from the rest of the probe around 30 seconds after the beginning of the descent.
The study of the probe behaviour needs to establish a self-similaritiy between the planet conditions. Indeed, Titan's atmosphere density is more than twice as high as Earth's. Furthermore, temperature, pressure, viscosity and the probe speed fluctuate depending on altitude whereas the wind tunnel conditions remain still the same.
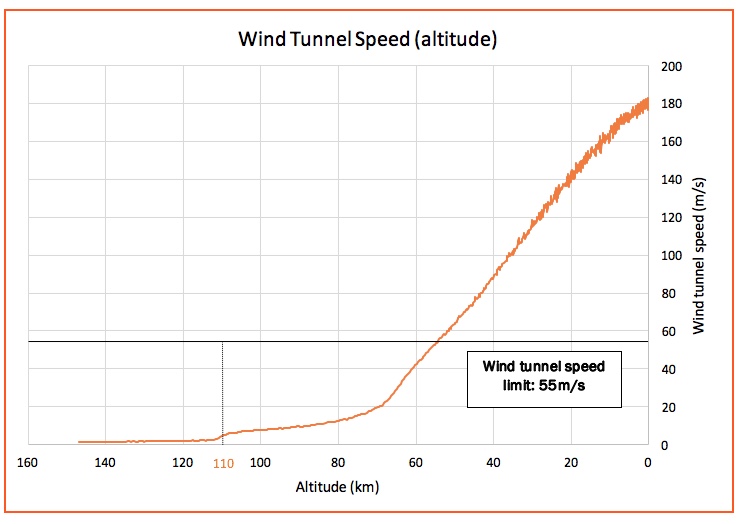
Reynolds number characterizes the type of flow, whether it is laminar or turbulent. Engineers calculate Reynolds numbers for each altitude and enforce the same Reynolds number to the wind tunnel. This enables them to reproduce the right probe behaviour during the descent on Titan and to levy the wind tunnel speed for tests. The following charts represent the results of this investigation:

The interesting altitude range is above 110 km during the main parachute descent. During this part of the fall, the simulation wind tunnel speeds are very low. However, even if wind tunnel cannot exceed 55 m.s-1 there is also a low speed constraint due to flow stability. Otherwise, the section of the graph below 110 km altitude represents the stabilized part of the descent.
In fact, the spin deviation appeared at the beginning of the descent sequence, meaning that the relevant tests should be conducted at low wind speeds (lower than 5 m.s-1). It corresponds to the part on the left of the stabilizer chute deployment line on the figure above. However, the range of the Malavard wind-tunnel goes from 10 to 50 m.s-1, making the realization of this kind of tests impossible. Moreover, with a wind speed set too low, the efforts applied to the model would be so small that the balance could not measure them.
A potential solution to this issue is to perform an analysis of the influence of Reynolds number on the flow regime around the model in the wind tunnel. If this analysis proves that the flow regime is not dependent of the Reynolds, the tests could be performed at a constant wind speed to compare the efforts on the different configurations. This wind speed shall be defined to allow the best recovery of the efforts measured by the balance.
*
Sources:
https://www.jpl.nasa.gov/spaceimages/images/largesize/PIA14832_hires.jpg
ESA (European Space Agency)

